
- ✓ Widgets
- ✓ Visual Analytics
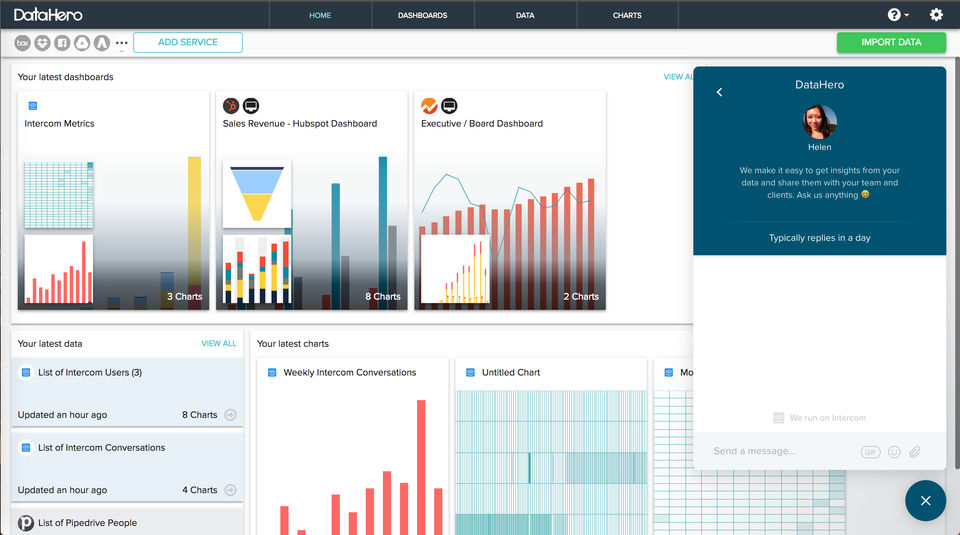
- ✓ Public Dashboard
- ✓ Private Dashboard
- ✓ Predefined Templates
- ✓ OLAP
- ✓ Interactive Dashboard
- ✓ Data Security
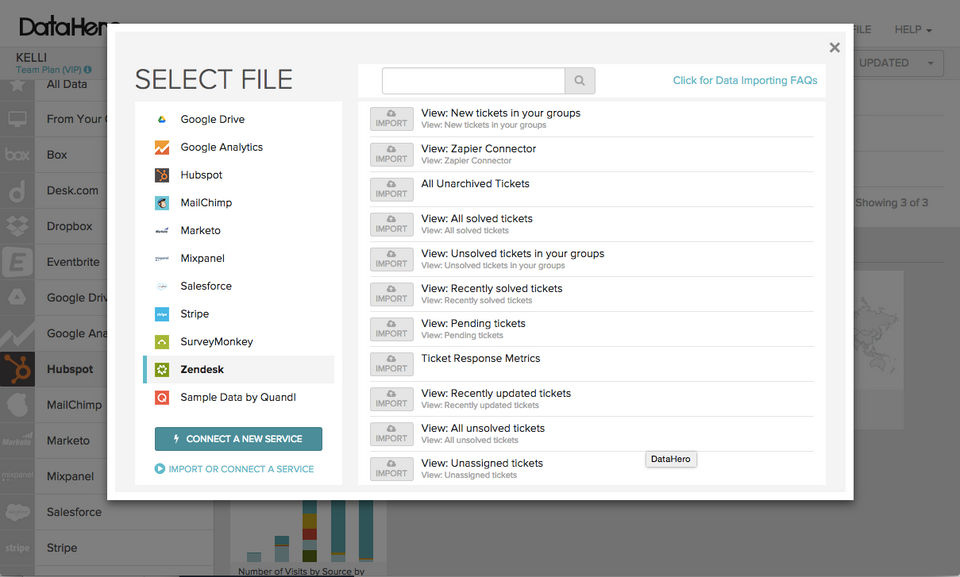
- ✓ Data Integration
- ✓ Key Performance Indicators
- ✓ Trend Indicators
- ✓ Strategic Planning
- ✓ Profitability Analysis
- ✓ Dashboard
- ✓ Benchmarking
- ✓ Ad hoc Reports
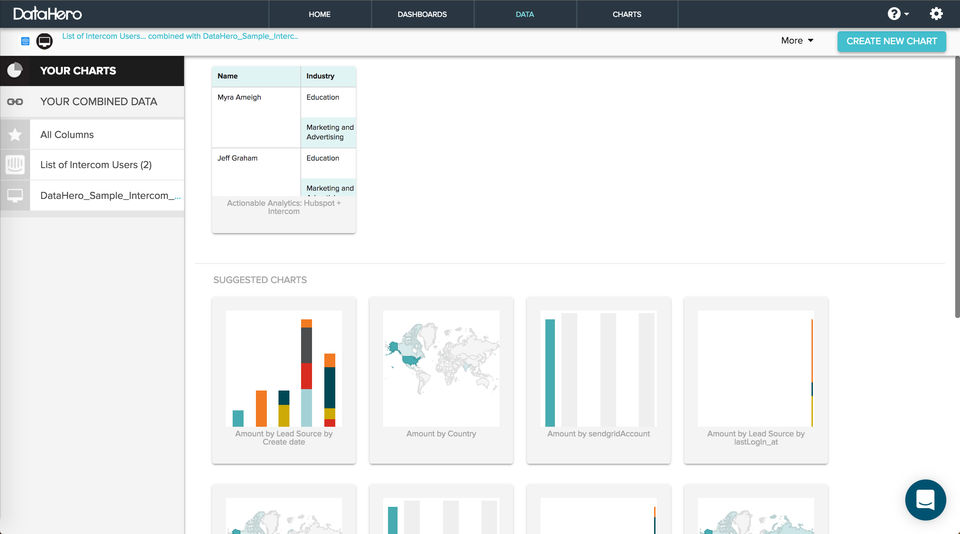
- ✓ Data Analysis
- ✓ Ad hoc Query
- ✓ Ad hoc Analysis
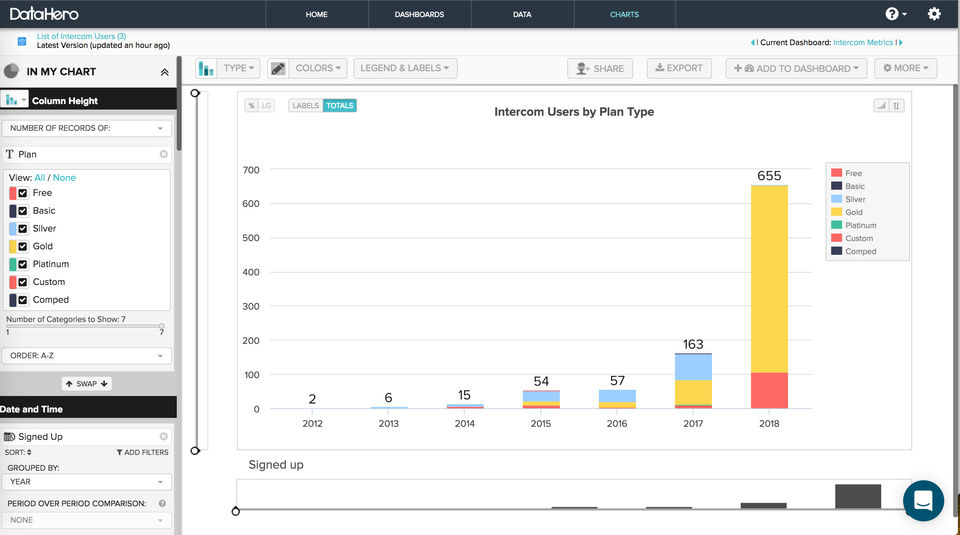
- Create unlimited charts
- Import data from multiple sources
- Secure hosted data warehouse
- Automatic DataDecoder ETL
- Export charts and datasets
- Uploads up to 2 MB each
- 1 user
- Create unlimited charts
- Import data from multiple sources
- Secure hosted data warehouse
- Automatic DataDecoder ETL
- Export charts and datasets
- Uploads up to 2 MB each
- 1 user
- Everything in Starter
- plus
- Create unlimited dashboards
- Combine datasets across services
- Schedule automatic updates
- Embed charts on 3rd party sites
- Uploads up to 10 MB each
- 1 user
- Everything in Starter
- plus
- Create unlimited dashboards
- Combine datasets across services
- Schedule automatic updates
- Embed charts on 3rd party sites
- Uploads up to 10 MB each
- 1 user
- Everything in Premium
- plus
- Create and administer teams
- Advanced sharing controls
- Unlimited dashboard viewers
- Custom logos and color palettes
- Uploads up to 40 MB each
- Minimum 3 users
- Everything in Premium
- plus
- Create and administer teams
- Advanced sharing controls
- Unlimited dashboard viewers
- Custom logos and color palettes
- Uploads up to 40 MB each
- Minimum 3 users
- Everything in Team
- plus
- Custom development & integrations
- Managed datasources and chart creation
- Enterprise-level support
- Multi-account or agency licenses
- Everything in Team
- plus
- Custom development & integrations
- Managed datasources and chart creation
- Enterprise-level support
- Multi-account or agency licenses
What do you like best? Assigning values to different axes is easy and reduces unnecessary complications that act as roadblocks in the speed of solution. What do you dislike? UI could add some new features as per the latest market trend . But thos...
What do you like best? I like to have quick overview of the data I'm working on so I don't lose the focus of where I am and where I am going. With DataHero I managed to create a quick overview of my data wich I can update very easily. What do ...
What do you like best? The ability to link graphs to each other is extremely useful because you can change the filters on a chart and all charts are changed to show the relevant data. This is the main feature that allows you to drill down. What do yo...
What do you like best? When analysing great amounts of information it's important to do not lose the focus of the study. With Datahero I have permanent vision of the data I'm working with. What do you dislike? It needs a bit of time to m...
What do you like best? Zero complicated software! I can cross information very quickly and visualize amazing results! I really like to have a view of the whole picture when I am working with big data. Thanks DataHero! What do you dislike? ...
DataHero offers 4 pricing plan(s):
- Starter — USD49.00 /Month
- Premium — USD79.00 /Month
- Team — USD99.00 /User/Month
- Agency / Enterprise — USD0.00
DataHero is a Dashboard Software solution. Top features include:
- Widgets
- Visual Analytics
- Public Dashboard
- Private Dashboard
- Predefined Templates
Yes, DataHero offers a 0-day free trial.
DataHero provides Phone,Email,Online (Ticket),Business Hours support.
DataHero is Cloud Hosted software.
DataHero provides Help Guides,Video Guides,Blogs for training.


