
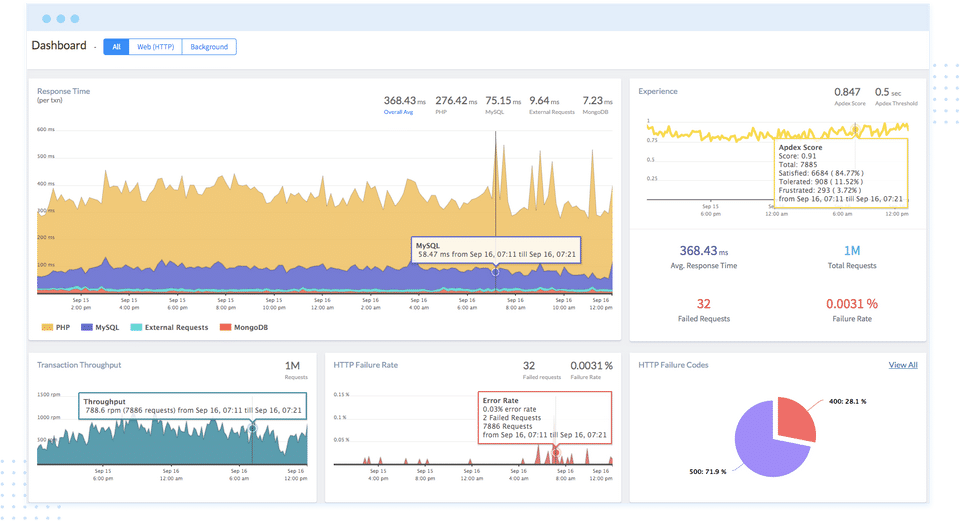
- ✓ Application Performance Metrics
- ✓ Synthetic Transaction Monitoring
- ✓ Real-user Monitoring
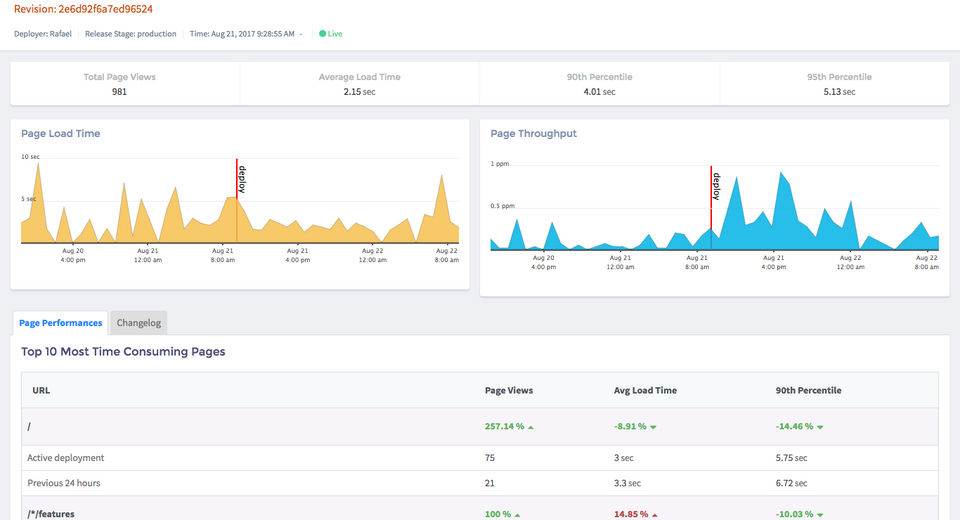
- ✓ Page Speed Monitoring
- ✓ Mobile User Monitoring
- ✓ Event Logs
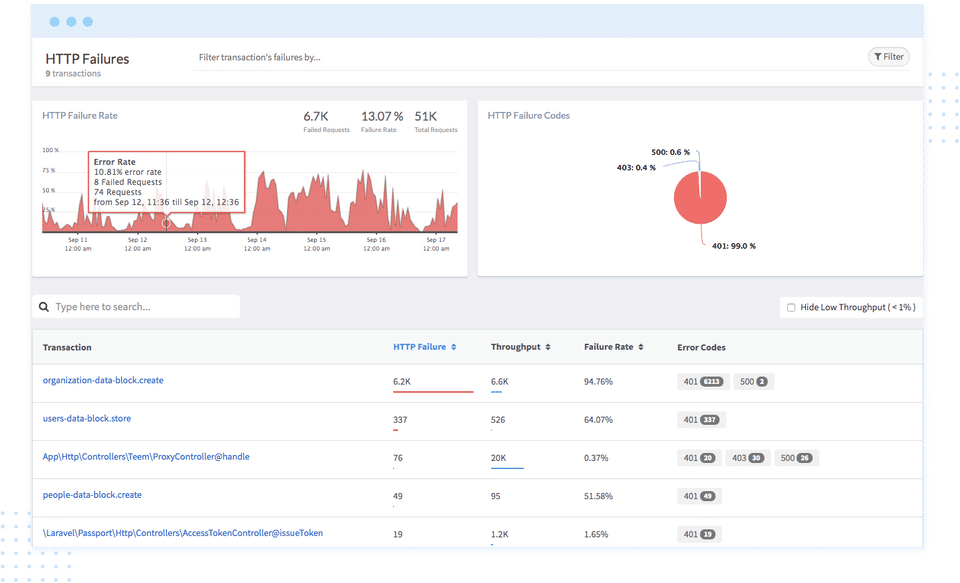
- ✓ API Monitoring
- ✓ Web Defacement Monitoring
- ✓ Uptime Reporting
- ✓ Event-based Notification
- ✓ Alerts (Notifications)
- ✓ Dashboard
- ✓ SSL Monitoring
- ✓ Password Protected Pages
- ✓ Mail Server Monitoring
- ✓ FTP Monitoring
- ✓ Maintenance Scheduling
- ✓ SLA Monitoring
- Transaction Monitoring
- Complete Tracing
- Database Monitoring
- External Requests Monitoring
- Exception Tracking
- Runtime System & Metrics
- Advanced search filtering
- Real-time alerts & summaries
- Deployment Tracking
- Integrate Slack
- JIRA & more
- Unlimited applications
- Unlimited team members
- Email support
- Priority support for enterprise plans
- Transaction Monitoring
- Complete Tracing
- Database Monitoring
- External Requests Monitoring
- Exception Tracking
- Runtime System & Metrics
- Advanced search filtering
- Real-t
- Real user monitoring (RUM)
- SPA Monitoring
- AJAX monitoring
- Contextual JS error tracking
- User tracking
- Session tracking
- Geography monitoring
- Transaction monitoring
- SourceMap support
- Core web vitals monitoring
- Advanced search filtering
- Real-time alerts & summaries
- Deployment Tracking
- Integrate Slack
- JIRA & more
- Unlimited applications
- Unlimited team members
- Email support
- Priority support for enterprise plans
- Real user monitoring (RUM)
- SPA Monitoring
- AJAX monitoring
- Contextual JS error tracking
- User
- CPU
- Memory & Disk Utilization
- Process Monitoring
- Health Checks
- Package Monitoring
- Advanced search filtering
- Real-time alerts & summaries
- Deployment Tracking
- Integrate Slack
- JIRA & more
- Unlimited applications
- Unlimited team members
- Email support
- Priority support for enterprise plans
- CPU
- Memory & Disk Utilization
- Process Monitoring
- Health Checks
- Package Monitoring
- Advanced search filtering
- Real-time alerts & summaries
- Deployment Tracking
- Integrate Slack
- JIRA & more
- Unlimited applications
- Unlim
- Live Tail
- Centralized Logging
- APM Integration
- Archiving
- Advanced search filtering
- Real-time alerts & summaries
- Deployment Tracking
- Integrate Slack
- JIRA & more
- Unlimited applications
- Unlimited team members
- Email support
- Priority support for enterprise plans
- Live Tail
- Centralized Logging
- APM Integration
- Archiving
- Advanced search filtering
- Real-time alerts & summaries
- Deployment Tracking
- Integrate Slack
- JIRA & more
- Unlimited applications
- Unlimited team members
- Email support
- Priority support for e
- HTTP
- TCP
- SSL
- DNS
- ICMP Checks
- MultiStep API Checks
- Multiple Geo Locations Checks
- Customize frequency of check runs
- Advanced search filtering
- Real-time alerts & summaries
- Deployment Tracking
- Integrate Slack
- JIRA & more
- Unlimited applications
- Unlimited team members
- Email support
- Priority support for enterprise plans
- HTTP
- TCP
- SSL
- DNS
- ICMP Checks
- MultiStep API Checks
- Multiple Geo Locations Checks
- Customize frequency of check runs
- Advanced search filtering
- Real-time alerts & summaries
- Deploym
- API Requests Monitoring
- Latency Insights
- User API Consumption
- API Failures
- Bots Monitoring
- API Metrics
- Advanced search filtering
- Real-time alerts & summaries
- Deployment Tracking
- Integrate Slack
- JIRA & more
- Unlimited applications
- Unlimited team members
- Email support
- Priority support for enterprise plans
- API Requests Monitoring
- Latency Insights
- User API Consumption
- API Failures
- Bots Monitoring
- API Metrics
- Advanced search filtering
- Real-time alerts & summaries
- Deployment Tracking
- Integrate Slack
What do you like best? It allows us to track uncaught javascript errors in production with great granularity. What do you dislike? It's a bit expensive for a pre-beta situation but will be well worth is once my startup gets into beta. ...
What do you like best? price, spot on! lot of features, easy to install and low on memory footprint What do you dislike? for website with many many query, dashboard can not keep up and going back further then 3 days would kill the da...
What do you like best? I use Atatus mainly for error tracking in my Angular web apps. It not only tells me when my clients have encountered an error, but the previous step that led up to that error. I can quickly research and fix the bugs. It also ...
What do you like best? Uso Atatus principalmente para el seguimiento de errores en mis aplicaciones web Angular. No solo me dice cuándo mis clientes han encontrado un error, sino el paso anterior que condujo a ese error. Puedo investigar y corregir...
What do you like best? ease of setup. slow requests log, error log breakdown. What do you dislike? Nothing so far. A bit on the expensive side. What problems are you solving with the product? What benefits have you realized? ...
Atatus offers 7 pricing plan(s):
- APM Monitoring — USD0.00
- Real User Monitoring — USD2.60 /Month
- Infrastructure Monitoring — USD0.00
- Logs Monitoring — USD2.50 /Month
- Synthetic Monitoring — USD2.00 /Month
- API Analytics Monitoring — USD1.50 /Month
- Custom — USD0.00
Atatus is a Application Performance Monitoring (APM) Tools solution. Top features include:
- Application Performance Metrics
- Synthetic Transaction Monitoring
- Real-user Monitoring
- Page Speed Monitoring
- Mobile User Monitoring
Yes, Atatus offers a 0-day free trial.
Atatus provides Online (Ticket) support.
Atatus is Cloud Hosted software.
Atatus provides Help Guides,Blogs for training.


